USD/JPY Nears Critical Fibonacci Support Level, Traders Eye Potential Rebound
The US Dollar to Japanese Yen exchange rate is testing a key technical support zone, drawing attention from market participants monitoring potential entry and exit levels.
 🧠AI Analysis
Photo: tradingview.com
Key points
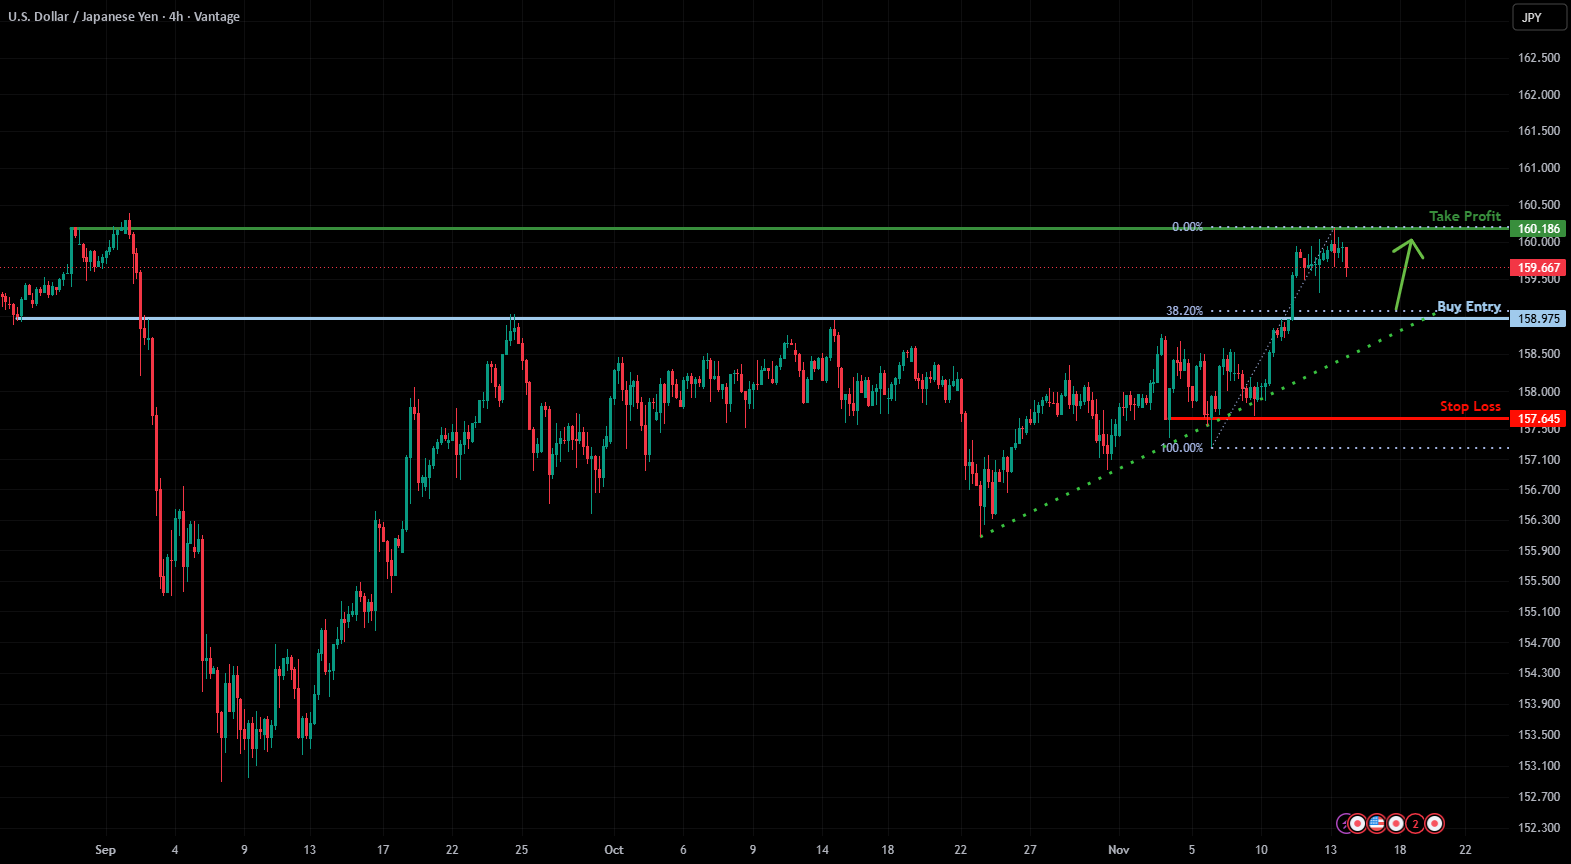
- USD/JPY approaches critical support matching the 38.2% Fibonacci retracement.
- Suggested entry is placed at 158.97 with a take profit target at 160.18.
- Risk management parameters include a stop loss set at 157.64.
The US Dollar is declining against the Japanese Yen, bringing the currency pair down toward a notable technical support floor. According to third-party market research provided by Everest Fortune Group to Vantage, this area aligns with the 38.2% Fibonacci retracement level and an overlapping support zone, which could trigger a price rebound.
Key Technical Levels to Monitor
Market analysts have identified specific thresholds for managing positions around this currency movement. The proposed entry level is set at 158.97, backed by the convergence of the Fibonacci retracement and overlapping support characteristics.
- Entry Point: 158.97, supported by technical convergence.
- Stop Loss: 157.64, anchored by pullback support.
- Take Profit: 160.18, positioned near a historical pullback resistance marker.
Disclaimer: Trading carries a high degree of risk, and past performance does not guarantee future results. Market participants remain solely responsible for their financial decisions.
What to watch next: Monitor whether the USD/JPY pair holds the 158.97 support line or breaches the 157.64 stop-loss threshold in upcoming sessions.
Source tradingview.com — tradingview.com/chart/USDJPY/fDPaHO92-Another-test-of-key-support/ ↗
Read next
 🧠AI Analysis
Mapping Out a $500 Stake in Two Emerging Quantum Computing Enterprises
A breakdown of a $500 allocation into Infleqtion and Xanadu reveals the high-risk, high-reward nature of early-stage quantum computing investments.
 🧠AI Analysis
Bitcoin Eyes Resistance Near $61,800 Following Support Bounce
Bitcoin displays bullish momentum after rebounding from a key support zone, with potential movement toward the 61,800 resistance level.
 🧠AI Analysis
Analyst Suggests Taking Profits on Global X MSCI Colombia ETF
Market analysts recommend locking in gains on Colombian equities amid current macroeconomic conditions.
 🧠AI Analysis
Anthropic IPO Momentum Fades as Stock Slips Below Opening Levels
Anthropic shares declined following a strong market debut, prompting market watchers to evaluate potential short-term downside risks.
 📈Markets
Bitcoin Tests Critical Monthly Support Level as Traders Watch for Breakdown or Rebound
Bitcoin is hovering near a vital monthly support level, with technical analysts warning that a close below this threshold could risk a drop toward the $32,000 region.
 🧠AI Analysis
Bitcoin Tests $58,000 Put Wall Following Market Flush
Bitcoin is hovering near the $58,000 level after dropping to a low of $55,127, with traders closely monitoring key support and resistance zones tied to upcoming options e…