Navigating the Nasdaq Correction: Why Historical Trends Favor Equities and How QQQ Offers Exposure
Following a recent dip in the Nasdaq Composite, historical data suggests strong potential for a rebound over the next six months.
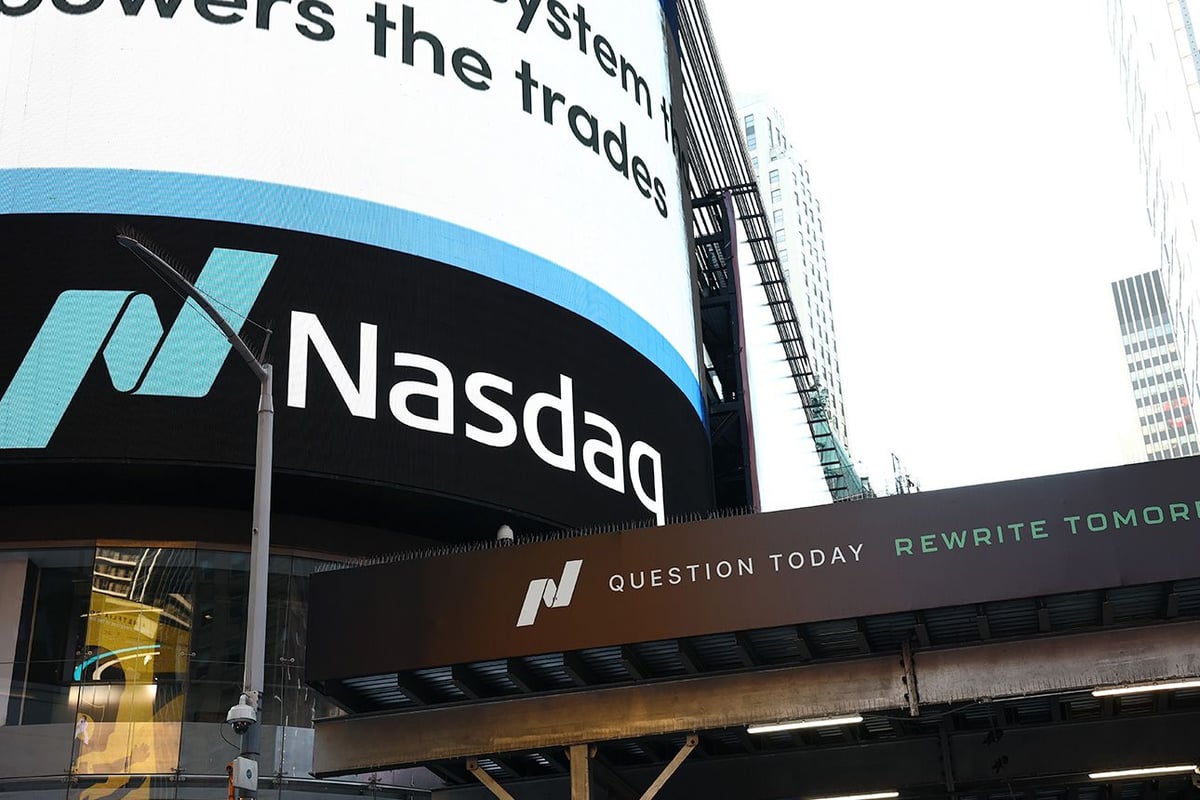 💼Investing
Photo: Motley Fool
Key points
- Nasdaq entered correction territory after an 11% drop from its October high.
- Historically, the index averages a 17% gain in the six months following a correction.
- The Invesco QQQ Trust offers concentrated exposure to the top 100 non-financial Nasdaq stocks.
The Nasdaq Composite experienced a notable shift on November 5, slipping more than 5% in a single session to enter correction territory. This downward movement brought the index 11% below its all-time high set on October 6, driven largely by uncertainty over potential policy changes regarding the artificial intelligence sector from a Democrat-led U.S. Congress. Despite the recent volatility, the index has regained some ground, climbing 5% over the week leading up to November 12.
For everyday investors watching these swings, the instinct to move to the sidelines and hold cash can be strong. However, historical performance indicates that sitting out during a correction may lead to missed opportunities. Across the 10 previous instances where the index hit correction territory, the Nasdaq generated an average return of 17% over the subsequent six months, with 2022 marking the only exception of a negative return.
To capture potential gains without picking individual equities, investors often look to exchange-traded funds such as the Invesco QQQ Trust (QQQ). The fund tracks the 100 largest non-financial stocks listed on the Nasdaq exchange, maintaining an expense ratio of 0.18%. Over the past decade through November 12, the ETF delivered a total return of 539%, translating to an annualized return of 20%.
While historical metrics and cost efficiency make the fund attractive, the portfolio carries heavy concentration. The top 10 holdings account for 46.3% of the total assets, with Apple representing the largest position at 8.4%. This structure ties performance heavily to major technology and artificial intelligence enterprises. Experts advise that participants should maintain a timeline of five years or longer to smooth out near-term volatility and let fundamental business growth guide performance.
Past trends prove that corrections present excellent buying opportunities for disciplined investors able to manage short-term emotional volatility.
Source Motley Fool — fool.com/investing/2026/11/16/history-says-nasdaq-gained-17-in-6-mo… ↗
Read next
 🧠AI Analysis
Walmart Shares Waver Despite Topping Estimates as Growth Momentum Cools
Walmart posted third-quarter results that surpassed analyst expectations, though slower growth rates across key segments prompted market hesitation before the stock recov…
 🧠AI Analysis
Bitcoin Slips Below Key Support Level as Bearish Technical Structure Takes Hold
Bitcoin recently traded around $59,090 following a decisive breakdown below the crucial $62,000–$64,000 support zone, shifting short-term market momentum toward sellers.
 🧠AI Analysis
Bitcoin Tests Support Following Drop Below $60,000 Milestone
Bitcoin recently swept the $55,000 mark before rebounding toward the $59,100 region following a sharp decline that broke previous support levels on November 20.
 🧠AI Analysis
Evaluating HF Sinclair and the Turning Oil Refining Cycle
HF Sinclair has experienced impressive expansion driven largely by its refining sector, but market observers suggest the cyclical peak may be near.
 🧠AI Analysis
Bitcoin Technical Outlook Signals Persistent Bearish Structure Despite Short-Term Bounce
Bitcoin remains constrained by a broader bearish pattern on short-term charts as dynamic trendline resistance caps recovery attempts. Although price recently rebounded fr…
 🧠AI Analysis
Mapping Out a $500 Stake in Two Emerging Quantum Computing Enterprises
A breakdown of a $500 allocation into Infleqtion and Xanadu reveals the high-risk, high-reward nature of early-stage quantum computing investments.