Strategy Inc Shares Hit 60-Day Low as Options Market Sees Large Call Block
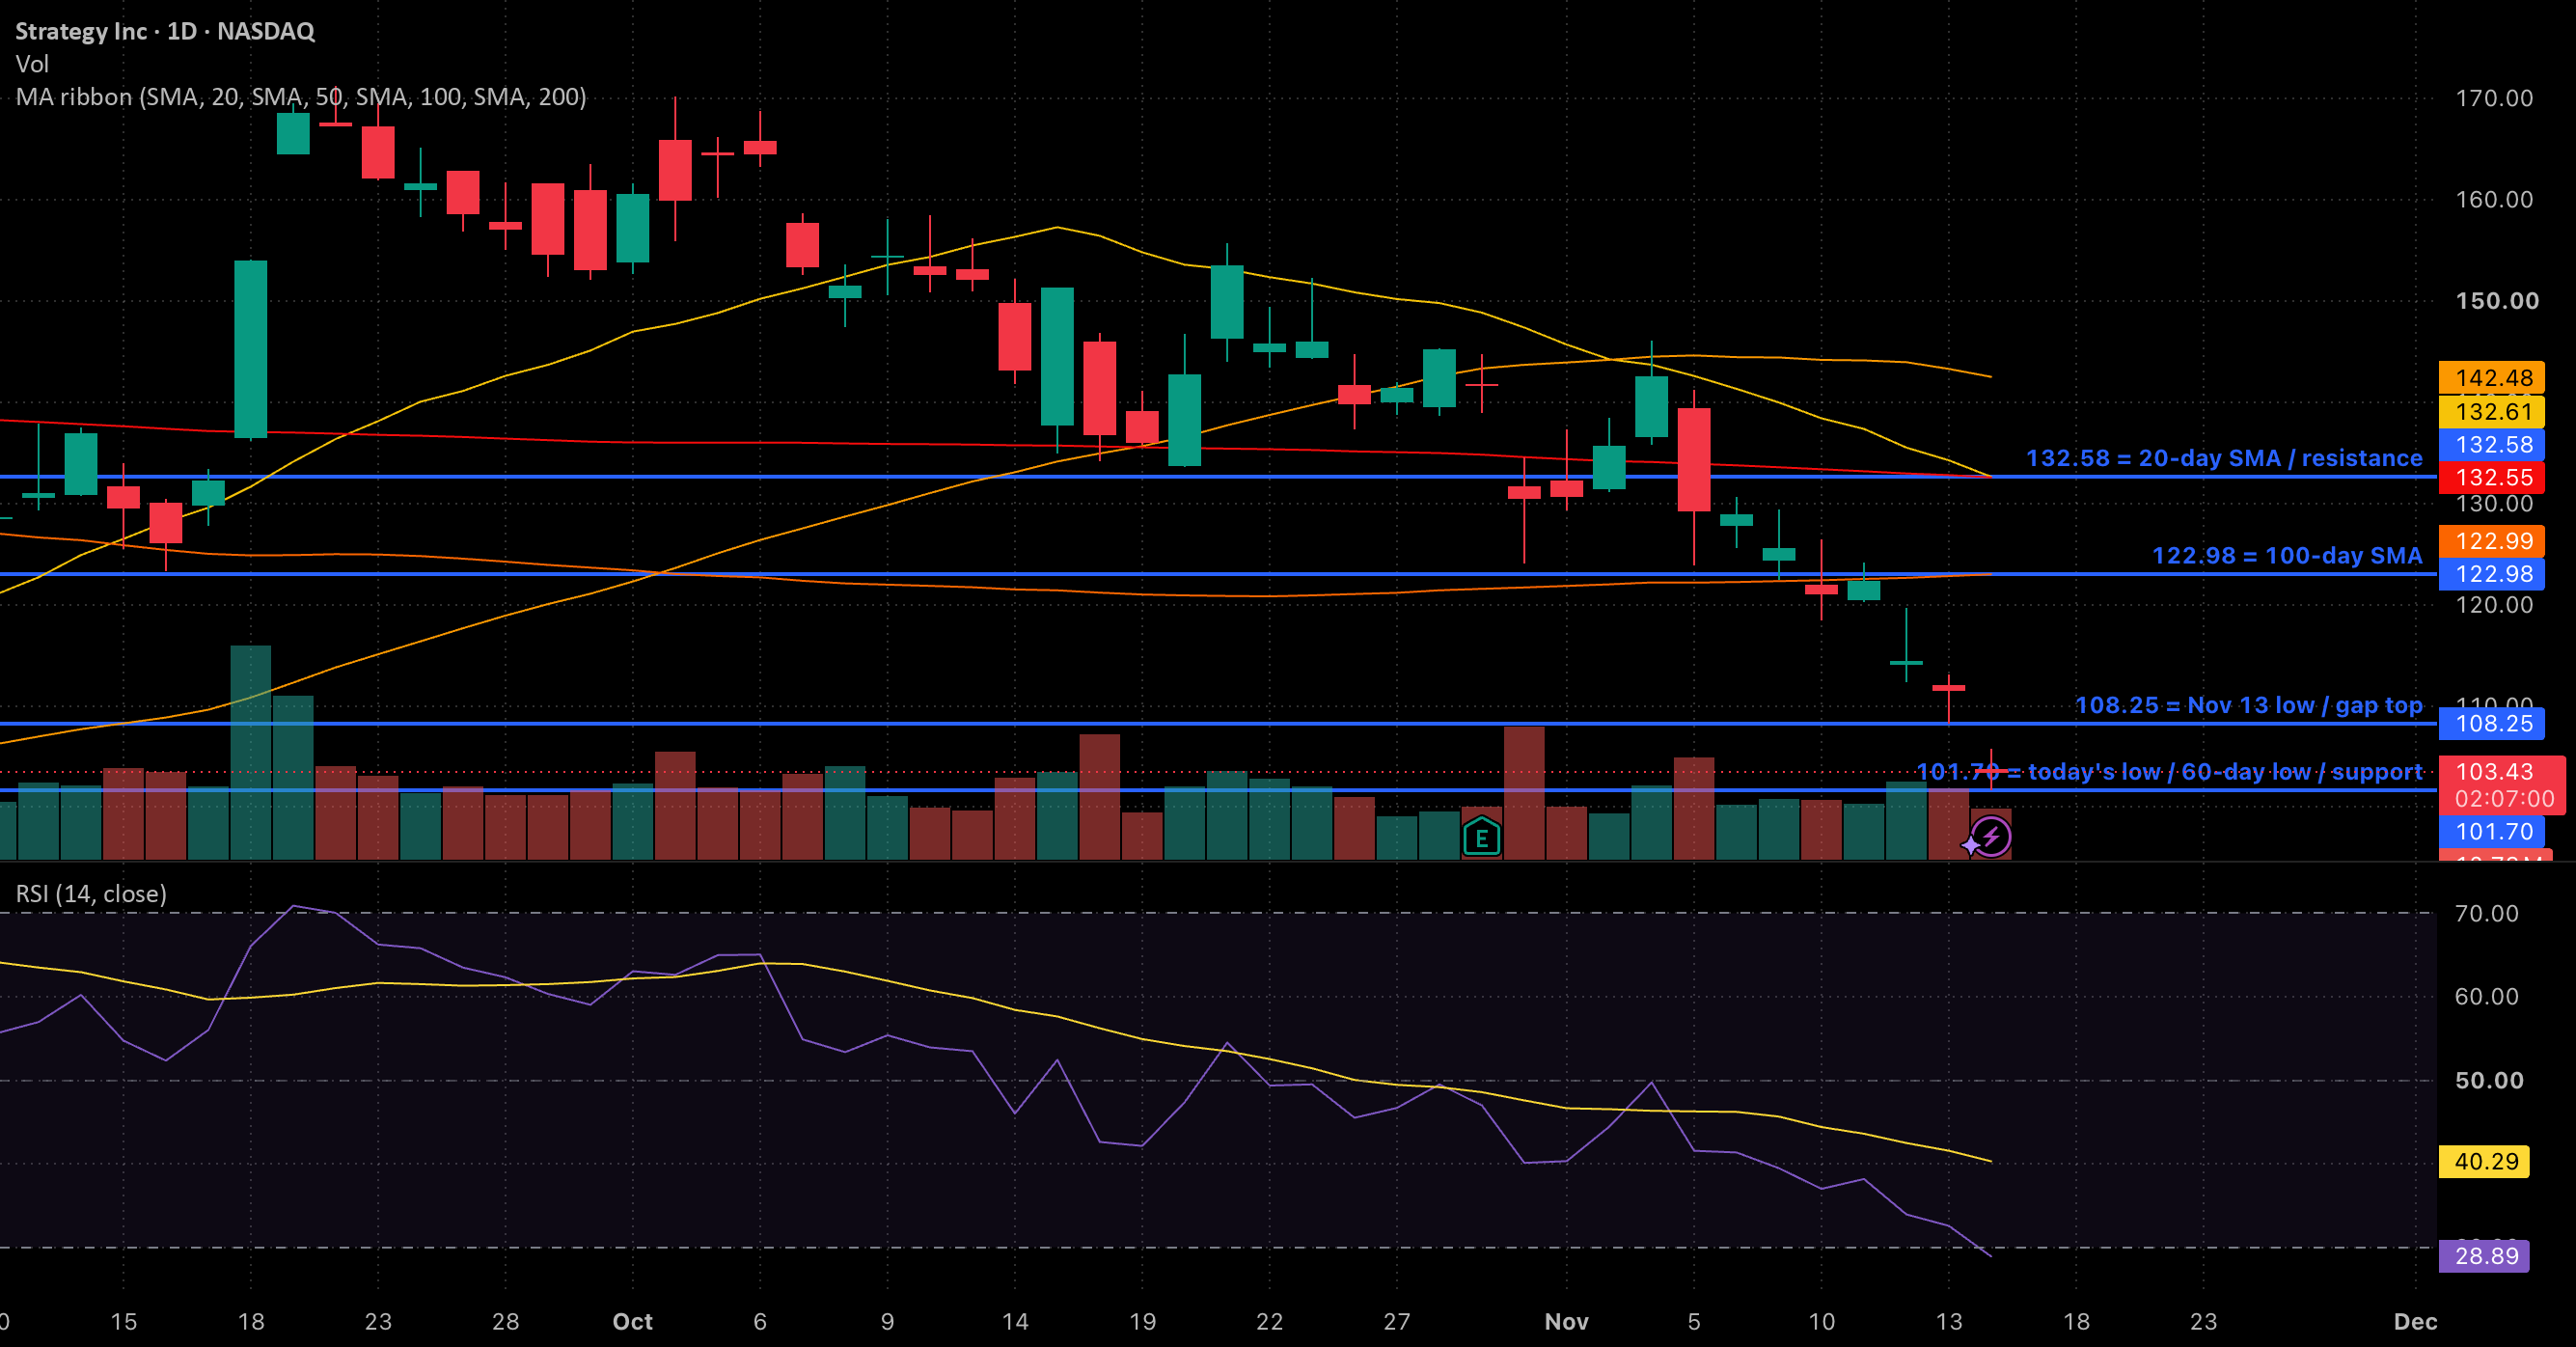
Strategy Inc Class A shares dropped approximately 7% to a 60-day low of 101.70, while the options tape registered a notable $20.6 million long-dated call trade.
 📈Markets
Photo: tradingview.com
Key points
- Strategy Inc shares fell roughly 7% to a 60-day low of 101.70.
- Options volume hit $141.9 million, with a notable $20.6 million block in January 2027 calls.
- Technical indicators place the 14-period RSI near 29 in oversold territory.
Strategy Inc Class A shares traded under pressure, sliding roughly 7% to touch a new 60-day low of 101.70. According to data from GTA Terminal, the equity fell beneath several key simple moving averages, including the 20-day SMA at 132.58 and the 200-day SMA at 132.55. The session opened at 103.74, creating a gap below the previous November 13 low of 108.25 as closes have steadily stepped lower through the month.
Despite the downward price action, the intraday options tape leaned toward the call side, accounting for 54% of total premium out of $141.9 million. A significant portion of this activity was driven by a single large transaction in January 2027 calls totaling about $20.6 million, with 18,608 contracts traded against an open interest of 1,187. Additional long-dated positioning included roughly $10.2 million in January 2028 calls and $4.2 million in January 2029 puts.
Technical indicators show the 14-period RSI hovering near 29, placing the stock in oversold territory. Market participants are monitoring the 108.25 level, where a recovery could fill the session's gap and align with the heavy long-dated call buying, whereas a daily close beneath the 101.70 support would extend the downward trend.
What to watch next: Watch for a potential move back above 108.25 to fill the gap, or a close under 101.70 that would deepen the current lows.
Source tradingview.com — tradingview.com/chart/MSTR/CSym9uOF-MSTR-20-6M-Jan-2027-Call-Block-… ↗
Read next
 🧠AI Analysis
Bitcoin Slips Below Key Support Level as Bearish Technical Structure Takes Hold
Bitcoin recently traded around $59,090 following a decisive breakdown below the crucial $62,000–$64,000 support zone, shifting short-term market momentum toward sellers.
 🧠AI Analysis
Bitcoin Tests Support Following Drop Below $60,000 Milestone
Bitcoin recently swept the $55,000 mark before rebounding toward the $59,100 region following a sharp decline that broke previous support levels on November 20.
 🧠AI Analysis
Evaluating HF Sinclair and the Turning Oil Refining Cycle
HF Sinclair has experienced impressive expansion driven largely by its refining sector, but market observers suggest the cyclical peak may be near.
 🧠AI Analysis
Bitcoin Technical Outlook Signals Persistent Bearish Structure Despite Short-Term Bounce
Bitcoin remains constrained by a broader bearish pattern on short-term charts as dynamic trendline resistance caps recovery attempts. Although price recently rebounded fr…
 🧠AI Analysis
Mapping Out a $500 Stake in Two Emerging Quantum Computing Enterprises
A breakdown of a $500 allocation into Infleqtion and Xanadu reveals the high-risk, high-reward nature of early-stage quantum computing investments.
 🧠AI Analysis
Bitcoin Eyes Resistance Near $61,800 Following Support Bounce
Bitcoin displays bullish momentum after rebounding from a key support zone, with potential movement toward the 61,800 resistance level.